GIS for Everyone: Implementing Accessibility Features
 0 min
0 minIn the realm of Geographic Information Systems (GIS), accessibility has become a crucial yet often overlooked aspect. While GIS technologies have revolutionized spatial data analysis and visualization, a significant gap exists in ensuring equal access for all users.
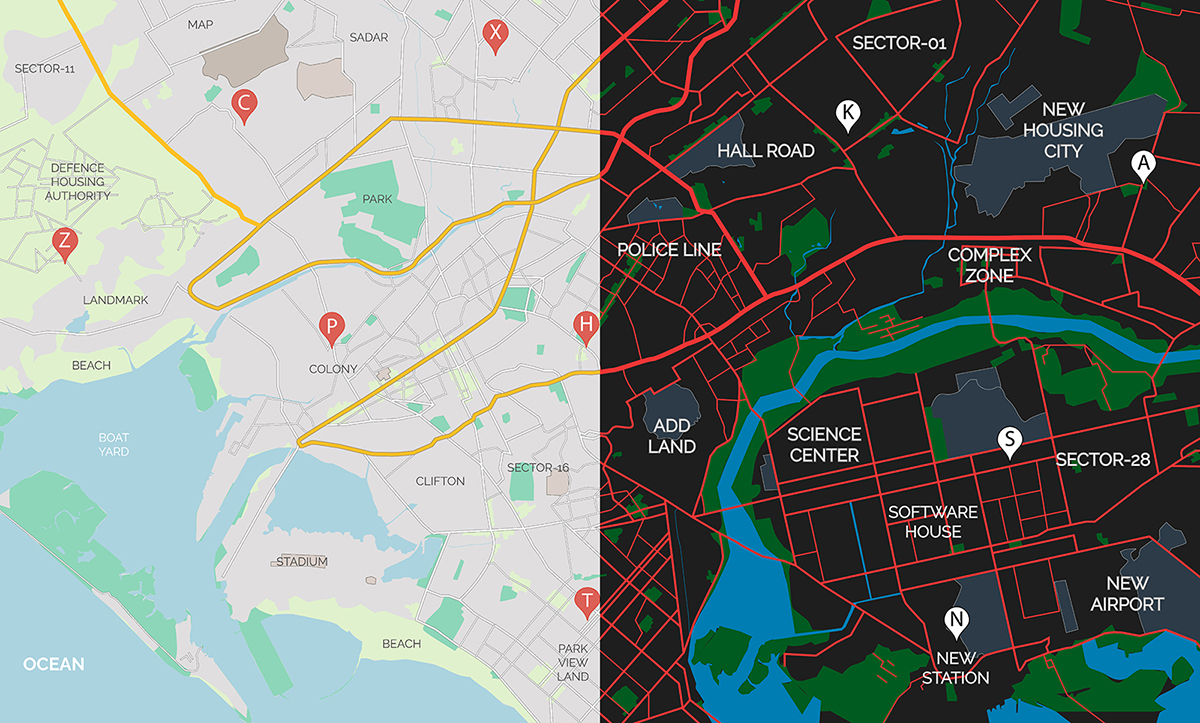
One area where accessibility in GIS falls short is in catering to color-blind or visually impaired individuals. Traditional GIS platforms often rely heavily on color to convey information, such as differentiating between features on a map or representing data through color-coded visualizations. However, these color-centric designs pose significant challenges for individuals with color vision deficiencies. By using alternative representation methods, these users can interpret maps and visualizations accurately, removing the risk of misinterpretation and potential errors in decision-making.

To address this issue, GIS solutions providers must prioritize implementing accessibility features tailored for these users. Here are 3 practical ways to make a change:
- Implementing High-Contrast and Large Font Options
Example: Include high-contrast modes and the ability to enlarge text for low-vision users. These options should be easily accessible from the main menu.
💡Idea to implement: In the settings, the user can toggle a high-contrast mode that changes the color scheme, improving readability. Additionally, a slider allows the user to increase the font size, ensuring that text labels and menu items are large enough to read comfortably.
- Providing Alternative Text for Images and Maps
Example: Ensure that all images, including maps, have alternative text descriptions accessible by screen readers. These descriptions should be detailed enough to convey similar information a sighted user would obtain.
💡Idea to implement: When the user’s screen reader focuses on a map area, it reads out: "Map of downtown area showing major roads, and public buildings. Main Street runs north to south, intersecting with park George Cosbuc near the central square."
- Offer Detailed User Guides and Support
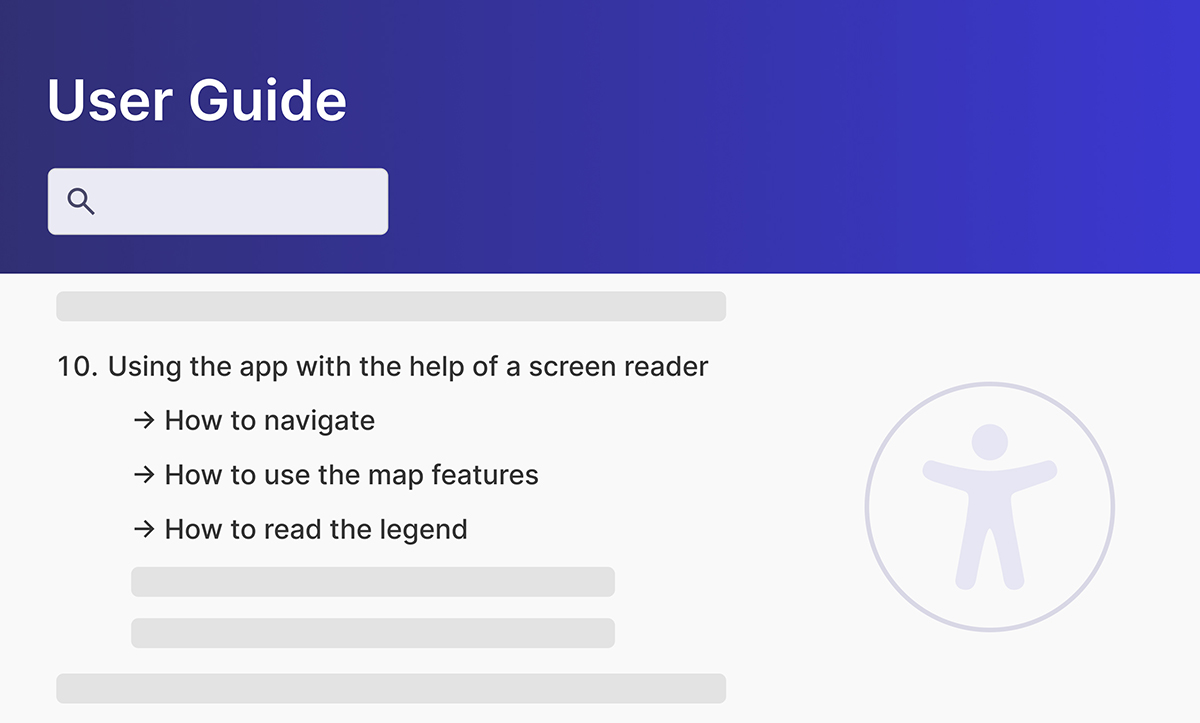
Example: Provide comprehensive user guides specifically tailored for visually impaired users, including step-by-step instructions on how to use accessibility features. Additionally offer dedicated support channels.
💡Idea to implement: The user guide includes a section on using the platform with a screen reader, explaining how to navigate, access different tools, and interpret map data.

By incorporating similar practical steps, a GIS platform can be made accessible and user-friendly for visually impaired individuals, ensuring they can effectively utilize its capabilities.
In conclusion, enhancing accessibility in GIS is an endeavor that requires proactive efforts from GIS solution providers, developers, and users alike. By recognizing the diverse needs of all users and implementing inclusive design principles, we can create GIS solutions that empower individuals of all abilities to leverage the power of spatial data effectively.