
Solutions for Insurance and Reinsurance
Quarticle helps insurance companies carry out precise geocoding and data enrichment, execute risk evaluation and mitigation, and assess pricing accuracy at a granular level, enabling insurers to thrive, unlock new insights, and increase market share.
Trusted by

"Quarticle’s geospatial intelligence platform allowed us to harmonize our application landscape. Finally, we can centrally manage all geospatial workflows and drive efficiency and effectiveness across our underwriting workflows. Providing our customers and brokers these significantly better and faster services not only saves operating costs, but also improves our underwriting decisions, and increases our margins – it allows us to provide the best-in-class experience to our users."
Client Success Stories

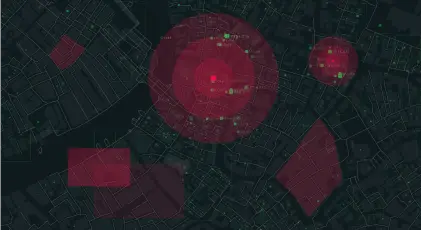

Visualize complex geospatial data
Combine various datasets with hazard layers to get deeper insights. Visualize your analysis through intuitive graphics and charts. Generate location analysis with risk scores, and portfolio analysis and download the information in PDF form.
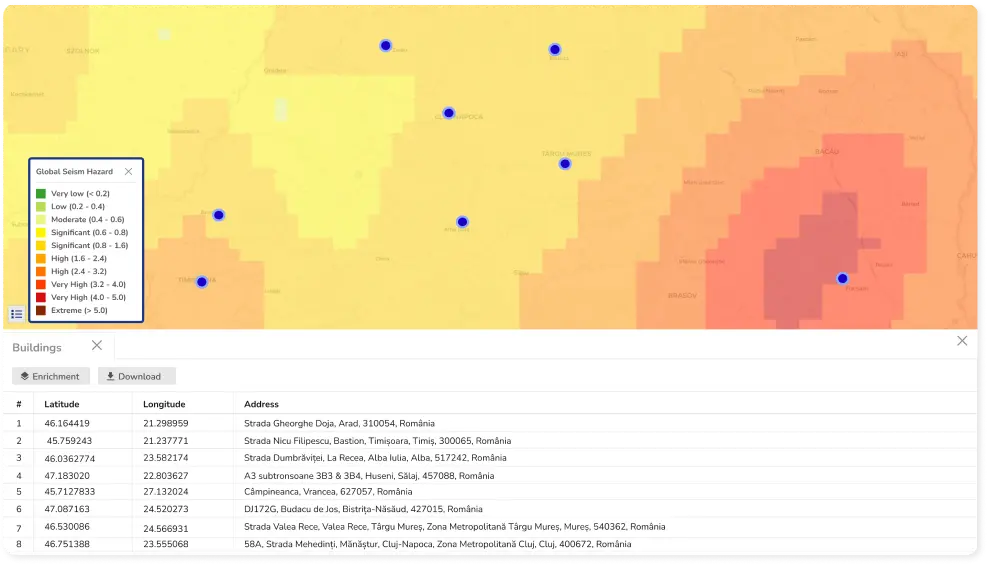
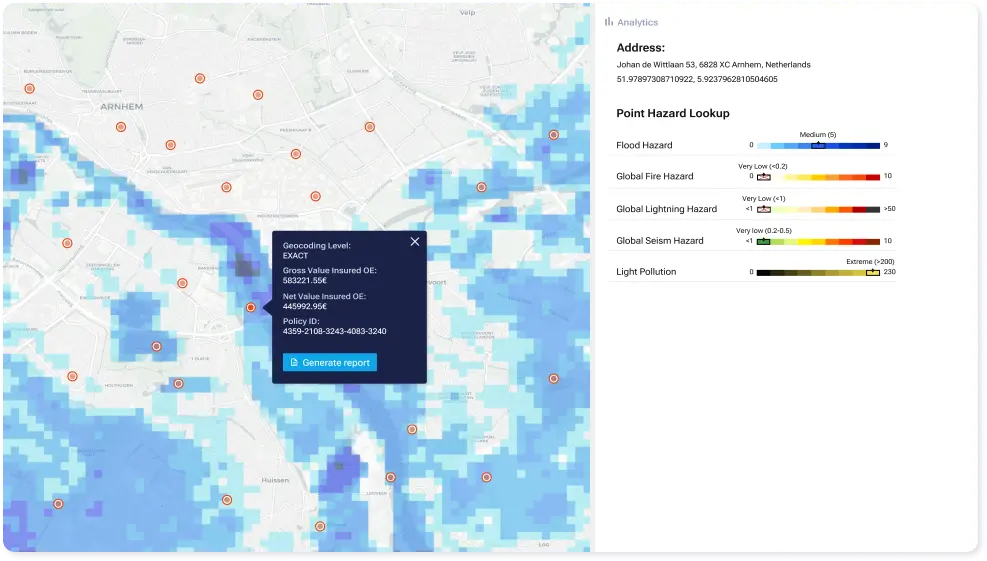
Plan effectively by conducting risk assessment
Analyze single-location risk scores and identify weak spots. Perform batch enrichment and assign hazard scores to large data sets in seconds. Rapidly import, enrich, and export CSV files. Conduct geocoding & reverse geocoding to generate coordinates and addresses.
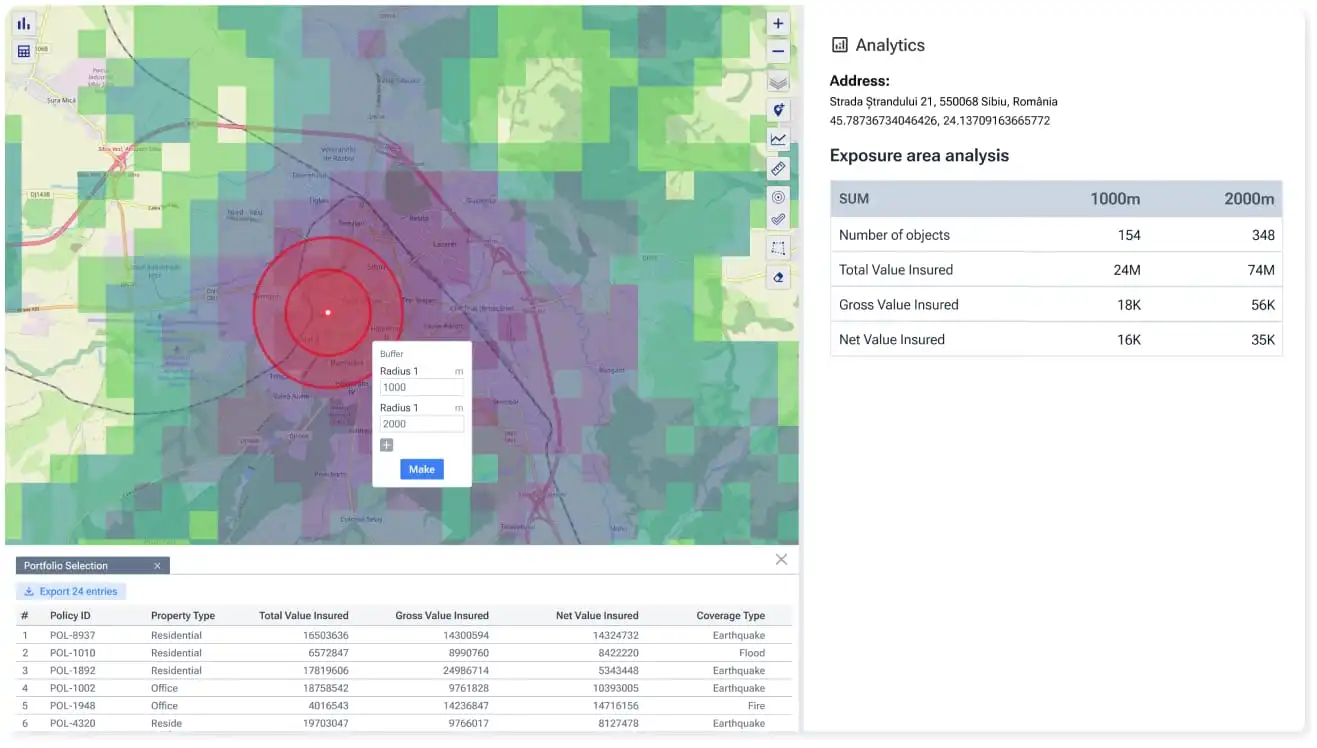
Assess accumulation across portfolios with detailed, fast spatial analysis
Map and analyze your entire portfolio with ease. Visualize assets, policies, and real estate directly on the map, with tools like aggregation by district, concentric circles, polygon, and shape selection. Manage your portfolio and get useful findings through filtering and interactive data layers.
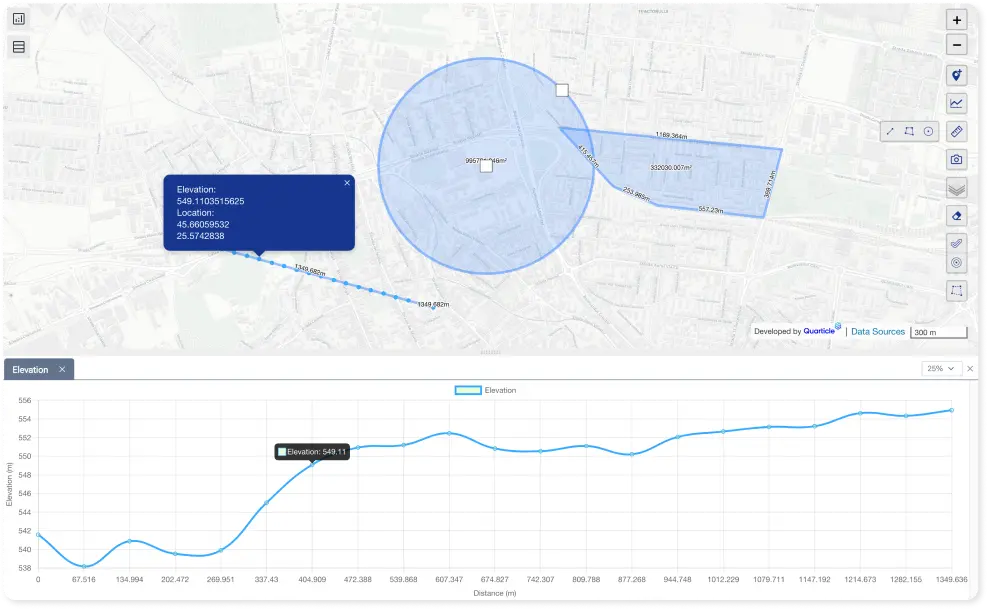
Ready-to-use data enhanced by interactive map tools
Display and maneuver standard background maps and aerial/satellite imagery. Graph, our front-end framework, provides you with precise measurement tools (length, area by rectangle, polygon, and circle) and profile elevation tools you can use according to your business needs. Once you’ve finished the analysis, the data can be exported as a CSV or PDF report and shared with internal and external stakeholders to ease communication.