Using severe weather predictions to forecast power lines damages
 0 min
0 minAlmost all of our day-to-day activities heavily depend on electricity and power usage, from telecommunications and transportation to different forms of entertainment and leisure activities. However, the electricity supply can be unexpectedly interrupted by various factors, one of the main ones being severe weather phenomena such as wind storms, and heavy rainfall that could lead to landslides or severe lightning. Thus, an accurate forecast of these events, coupled with geo-spatial data which shows the coverage of the power distribution network is extremely useful in assessing any future damage in case of an extreme weather event. The analysis could allow time for contingency plans to be put in place and prepare intervention teams when damage is caused to the power grid.
We’ve conducted a simple, yet powerful GIS analysis methodology to assess the areas with a potential for severe thunderstorms and extracted the European power grid data that can be affected by such events. To exemplify this, we’ve done a case study test for May 31st, 2022, a day in which powerful storms came over the southern and south-eastern parts of Europe.
The first step in the analysis was to produce a high-resolution numerical weather forecast from which we extracted a severe weather parameter, called CAPE (Convective Available Potential Energy), which correlates to how much potential energy a storm has if it will occur (or the amount of fuel available to a developing thunderstorm). More specifically, it describes the instability of the atmosphere and provides an approximation of updraft strength within a thunderstorm. A higher value of CAPE means the atmosphere is more unstable and would therefore produce a stronger updraft. This parameter is very useful in assessing the severity of a potential storm.
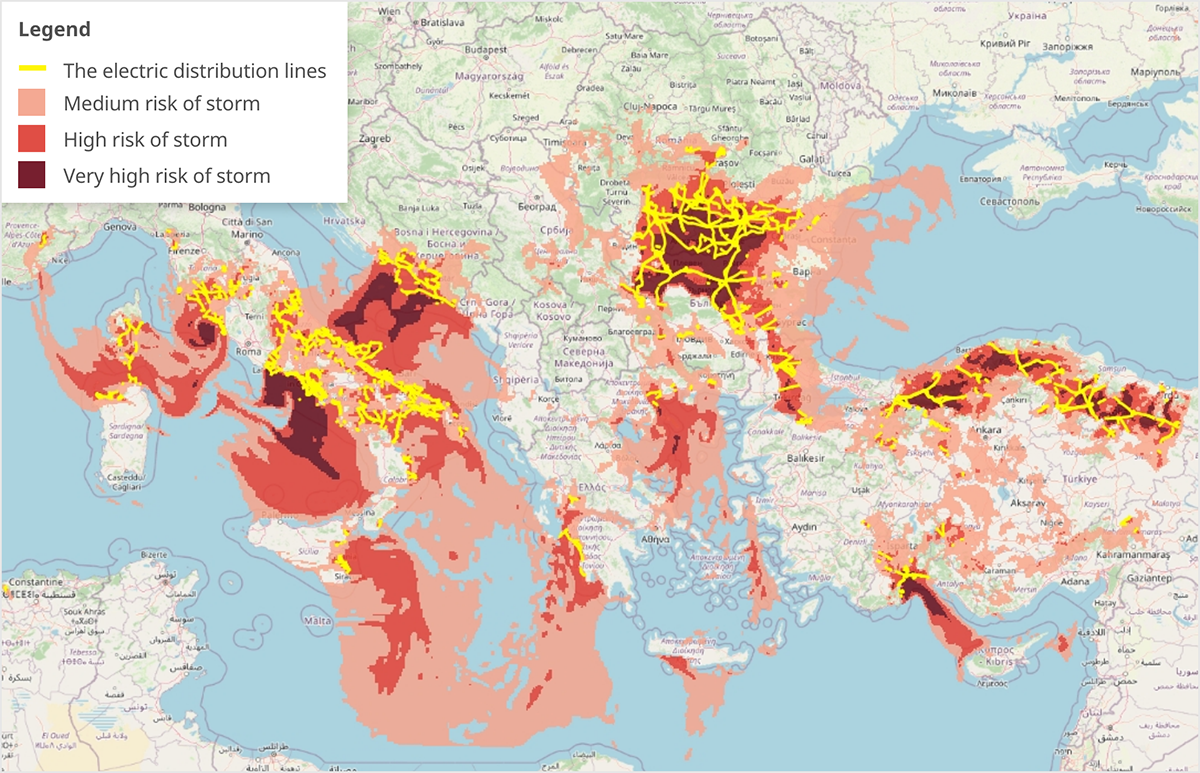
The following step was to load the CAPE parameter in a GIS analysis software and classify it into three categories (medium, high, and very high-risk) and then extract the European power lines network data that overlaps with the high and very high-risk zones. In the end, we retrieved only the areas of the electrical distribution network that can be potentially affected by severe storms.
The map below shows the results (the shades of red are the results from the CAPE parameter and in yellow are the electrical distribution lines):

Although this is just a demo use case, other severe weather risk parameters can be analyzed spatially and combined with various infrastructure datasets, to yield a final analysis or prediction which can be used by infrastructure owners, local authorities, and the general public.
At Quarticle we use GIS technology that helps to identify areas that are at a high risk of natural disasters (flood, tornado, storms, etc.) through the analysis of various datasets such as demographic data, meteorological data, and geological data. Reach out at [email protected] and let’s discuss how we can help you accurately assess potential risks or losses and optimize your business strategies.